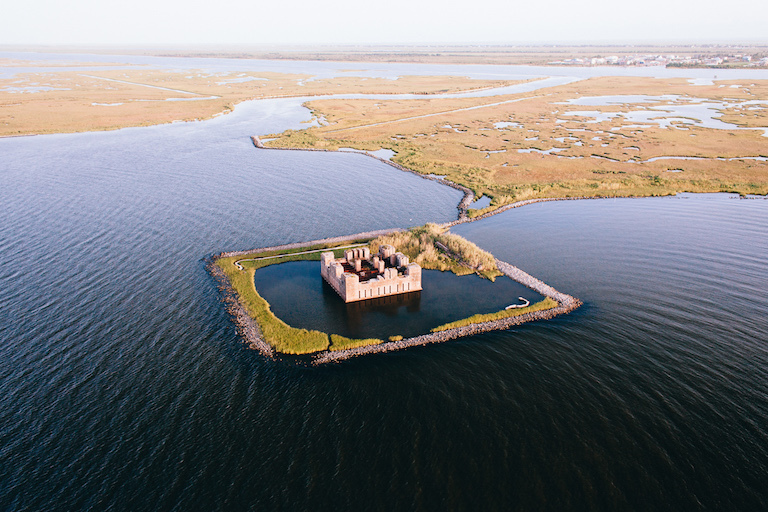
The ruins of a Civil War-era structure, Fort Beauregard, lie partially submerged east of New Orleans. Researchers say many large coastal cities around the world sink faster than sea levels rise. Credit: Frank McMains.
While the threat of rising seas is well established, a phenomenon that is, in a sense, its opposite receives far fewer headlines: large coastal cities sinking faster than oceans can rise.
That is the conclusion of a review article published by a team of scientists who recently assembled in New Orleans, La., and in Venice, Italy, to examine the problem. Extraction of groundwater or fossil fuels, and sometimes simply generations of farming, are causing large metropolitan areas in coastal zones around the world to subside surprisingly quickly—making the relative rise of adjacent seas an even greater potential hazard.
“Sea level rise is a problem, and subsidence is a huge problem, too,” said Cathleen Jones, a researcher at NASA’s Jet Propulsion Laboratory in Pasadena who specializes in such hazards and is a member of the New Orleans team.
“There are areas where it is happening more rapidly than sea level rise,” she said. “I think it is not fully appreciated how much greater subsidence is in some of these areas, and how much it contributes to the loss of wetlands.”
Rapid subsidence makes many of these areas more vulnerable to the effects of climate change, especially those at elevations less than 10 meters (33 feet) above sea level. Several of these qualify as “megacities,” with populations greater than 10 million.
The most threatened: large river deltas, home to an estimated 500 million people. The fastest subsidence rate, 250 millimeters or nearly 10 inches per year, was seen in China’s Huanghe Delta. Southeast Asia saw 30 to 60 millimeters (1.2 to 2.4 inches) per year, while Katrina-ravaged portions of New Orleans saw rates as high as 35 millimeters (1.4 inches) per year.
The article, published in July 2016 in Earth and Space Science News, reports the group’s findings from New Orleans, where they held the first of two workshops. The city is part of the subsiding Mississippi Delta, a cause of wetland loss and the degradation of barrier islands, which, in turn, poses a threat to coastal ecosystems—as well as risks to human populations and infrastructure. Groundwater extraction and drainage of peat-rich soils, the article says, are to blame.
Dropping delta
The Sacramento River Bay Delta, though not mentioned in the report, is another site of severe subsidence, Jones said.
“It’s a bigger problem than sea level rise in the Sacramento delta,” she said. “Subsidence is largely driven there by the lowering water table. You have crops to grow; whenever you dry out soil with high carbon content, it will oxidize. It gives off carbon dioxide, loses mass and compacts. There, sea level rise is just a minor influence on it at this time. I’m not saying to ignore it, but right now these areas are threatened more by subsidence.”
While both human and natural factors contribute to subsidence, the natural processes—apart from tectonic disturbances—mostly act over very long timescales. Human causes appear to be driving the most rapid subsidence rates.
Lead author Mead Allison of the Water Institute of the Gulf in Baton Rouge, Jones and the rest of the 12-member science team advocate the creation of “supersites” around the world, like the one being assembled in New Orleans, to track a variety of contributors to subsidence.
At these sites, remote sensing would be combined with ground sensor networks to track subsidence over years. In New Orleans, that has in the past included use of the interferometric synthetic aperture radar (InSAR) instrument aboard JPL’s Uninhabited Aerial Vehicle Synthetic Aperture Radar (UAVSAR) aircraft, gathering data there during 2009-2015.
“(We want) to try to start getting more of these supersites, where we try to differentiate all the different contributions,” Jones said. “So that instead of just measuring subsidence overall, we try to figure out what parts are sediment loading, what parts (are other factors). Whenever we know how much comes from each of these, we can begin to implement policy that would remediate the ones that are anthropogenic in origin.”
By Laurie J. Schmidt,
NASA's Jet Propulsion Laboratory
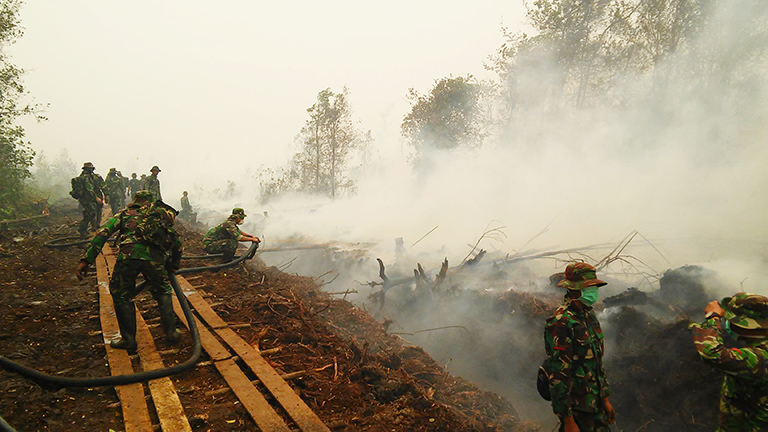
Indonesian military personnel fighting a large peat fire near the city of Palangkaraya in the Indonesian province of Central Kalimantan on Borneo. (October 14, 2015, David Gaveau, Center for International Forestry Research)
For many people, the term El Niño foretells a cyclical weather pattern that brings increased rainfall and more intense storms. But not every place on Earth responds to El Niño with wetter conditions. In some locations, like Indonesia, the change in ocean temperatures and atmospheric patterns brought about by El Niño has the opposite effect—shifting thunderstorms eastward and causing extremely dry conditions. In 2015, this "drying out" effect triggered one of the most severe fire seasons on record in Indonesia.
“For Indonesia burning, it was the most significant event that we’ve seen during the 15-year satellite record,” according to Robert Field, a Columbia University research scientist at the NASA Goddard Institute for Space Studies who specializes in climate modeling and fire science. “The smoke plume stretched halfway around the world at the equator, and the fire-prone areas were blanketed in really thick smoke for six to eight weeks continuously.”
The global concentration of carbon monoxide at approximately 18,000 feet (5,500 meters) altitude, as measured in hectopascals (a measurement of barometric pressure), from October 26 to 28, 2015. It is estimated that more than 43 million people have been inhaling toxic fumes, and large parts of Indonesia have been placed in a state of emergency. Credit:JPL/NASA.
Aside from the destruction caused by the burning, the fires wreaked havoc on local and regional air quality. By early September, six Indonesian provinces had declared a state of emergency due to the haze caused by carbon monoxide and other gas pollutants emitted during burning. “You have hazardously high air pollution levels without a break, and it impacts the entire Southeast Asia region, including Singapore, west Malaysia and southern Thailand,” Field said.
A closer view of carbon monoxide concentration over Indonesia, from October 16 to 25, 2015. Credit: Robert Field, NASA GISS/Columbia University.
And, Field said, there’s a "wild card" in Indonesia that intensifies fire events—the peatlands. Indonesian forests are home to roughly 60 percent of the world’s tropical peatlands, where decayed vegetation or organic matter has accumulated in the soil layers and created peat deposits that can be up to 10 meters deep. “Once these fires get underground into the peat, they don’t stop burning until the seasonal rains return, and that happens later during El Niño episodes,” Field said. “They just burn and burn and produce smoke continuously, and they can’t be put out through conventional fire-fighting.”
Field and his colleagues analyzed data from the Atmospheric Infrared Sounder (AIRS) and four other satellite instruments, along with airport visibility records, to understand the drought conditions under which the 2015 fires in Indonesia occurred. By looking at carbon monoxide levels, aerosol quantities and thermal signatures from active fires, they were able to not only track the event while it happened, but also frame it within the context of previous fire episodes in the 15-year satellite record. “AIRS was my go-to data source for monitoring the extent of the smoke plume during the Indonesian fire event,” Field said. “Along with the other measurements we looked at, AIRS data gave us a full picture of the impacts of these fires.”
The analysis also enabled the team to identify a seasonal rainfall threshold—a baseline above which conditions are too wet to permit any burning. “When you get below this threshold, the peat has enough time to dry out under the very hot equatorial conditions,” Field said. “And the further below that threshold you go and the longer the dry season, the more fire you see.”
The correlation between the rainfall threshold and increased fire activity was evident across all satellite data used in the study, which makes the threshold a useful benchmark for predicting and preparing for potential fire episodes. “Because the influence of El Niño on Indonesian rainfall is so direct, we can increasingly anticipate these conditions in advance, so the rainfall threshold is a red flag and gives us an early warning system,” Field said. “It’s a bit like a freight train, and we can see it coming.”
August 2016 was the warmest August in 136 years of modern record-keeping, according to a monthly analysis of global temperatures by scientists at NASA's Goddard Institute for Space Studies (GISS) in New York.
Although the seasonal temperature cycle typically peaks in July, August 2016 wound up tied with July 2016 for the warmest month ever recorded. August 2016's temperature was 0.16 degrees Celsius warmer than the previous warmest August in 2014. Last month also was 0.98 degrees Celsius warmer than the mean August temperature from 1951-1980.
"Monthly rankings, which vary by only a few hundredths of a degree, are inherently fragile," according to GISS Director Gavin Schmidt. "We stress that the long-term trends are the most important for understanding the ongoing changes that are affecting our planet."
The record warm August continued a streak of 11 consecutive months dating back to October 2015 that have set new monthly high-temperature records. The monthly analysis by the GISS team is assembled from publicly available data acquired by about 6,300 meteorological stations around the world, ship- and buoy-based instruments measuring sea surface temperature, and Antarctic research stations. The modern global temperature record begins around 1880 because previous observations didn't cover enough of the planet.
Air is all around us, but we can’t see it. So what is air, exactly? It’s a mixture of different gases. The air in Earth’s atmosphere is made up of approximately 78 percent nitrogen and 21 percent oxygen. Air also has small amounts of lots of other gases, too, such as carbon dioxide, neon, and hydrogen.
Air isn’t just gas
While air is mostly gas, it also holds lots of tiny particles. These particles in the air are called aerosols. Some aerosols—like dust and pollen—are picked up naturally when the wind blows. But the air can also carry particles that cause air pollution, such as the soot, smoke, and other pollutants from car exhaust and power plants. When there are too many particles in the air, it can be difficult for plants and animals to breathe.
Air is important for living things
People need to breathe, and so do lots of other animals—and plants! Breathing is part of a process called respiration. During respiration, a living thing takes in oxygen from the air and gives out carbon dioxide. This process gives animals and plants the energy to eat, grow, and live life!
Carbon dioxide in the air can be both good and bad
When humans and animals breathe, we give off an odorless gas called carbon dioxide, or CO2. Plants use this gas, along with sunlight, to make food—a process called photosynthesis. In this process, plants give off oxygen, too! However, large amounts of CO2 are also produced when cars and power plants burn coal, oil, and gasoline. CO2 is also the most important contributor to human-caused global warming.
Air also holds water
When it’s a hot, muggy summer day, you’ve probably heard the word “humid.” But what does that mean, exactly? Relative humidity is the amount of water that the air can hold before it rains. Humidity is usually measured in percentages, so the highest level of relative humidity—right before it rains—is 100%. Humidity in the air is measured with an instrument called a psychrometer.
Air changes as you go up, up, up
Air seems light, but there is a lot of it pushing down on Earth’s surface. This is called air pressure. You experience high air pressure at sea level because the whole atmosphere is pushing down on you. When you’re on top of a mountain, there is less air pushing on you and the pressure is low. That change in pressure can cause your ears to pop when you’re taking off in an airplane or driving up a hill.
Air is a protective cushion
On Earth, we’re pretty lucky to have an atmosphere filled with air. The air in our atmosphere acts as insulation, keeping the Earth from getting too cold or too hot. Ozone, another type of gas in the air, also protects us from too much sunlight. Air in the atmosphere protects us from meteors. Once a meteor comes into contact with our atmosphere, it rubs against the air and is burned into small pieces before it reaches the Earth.
There is life in the air
Lots of living things make their homes in soil and water. But did you know that living organisms can also be found hanging out in the air? These tiny microbial organisms are called bioaerosols. Although these microbes can’t fly, they can travel long distances through the air—via wind, rain, or even a sneeze!
Air can move fast and far
Even on a very still day, the air around us is always moving. But when a big wind comes, that air can really go! The fastest gust of wind ever recorded on Earth clocked in at 253 miles per hour. And as the wind picks up seeds and dust and other particles, it can carry them miles away from their original home!
Air pollution can ruin your outdoor plans
Air pollution is measured with the Air Quality Index, or AQI. The lower the AQI, the cleaner the air is. However, if you are outside when the AQI is over 100, it’s about the same as breathing in exhaust from a car all day! Things that cause poor air quality are forest fires and cities with lots of car traffic. If the AQI is higher than 100 you shouldn’t spend too much time outside.
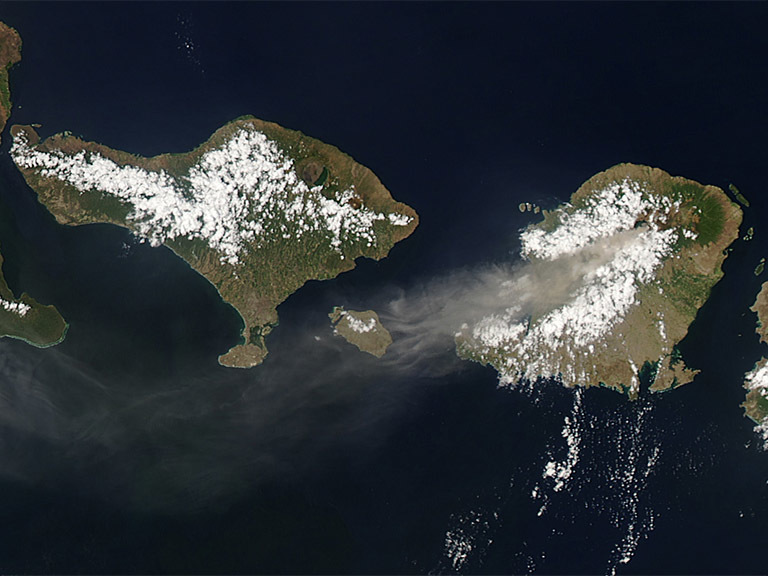
Aqua MODIS November 4, 2015 image of Mount Rinjani erupting ash. Large stratovolcanoes, like Rinjani, can spew a complex mixture of sulfur dioxide, water, ash, and halogens that interact with one another and the atmospheric chemistry and influence global climate. A new NASA GISS study illustrates how capturing the chemistry of the volcanic plume in the climate model is important for getting the right climate impact from volcanic eruptions. Credit: NASA.
Volcanic eruptions bring images of burning lava and ash, not water. A new NASA study has shown, however, that to correctly model the climate effects of an eruption — especially mega-eruptions many times larger than anything in recent history — scientists need to include the atmospheric effects of erupted water vapor.
For a thousand years before the Industrial Revolution, volcanoes were the greatest climate-changing force on Earth. A big eruption in the tropics cools much of the planet by throwing volcanic gases high into the atmosphere, where they change into microscopic particles known as aerosols and spread around the globe, reflecting incoming sunlight. The 1991 eruption of Mt. Pinatubo in the Philippines cooled Earth enough to completely offset the effects of greenhouse-gas-induced warming for about two years.
Pinatubo was the largest eruption of the last century, but some eruptions of the last millennium are estimated to have been 10 times larger, such as the eruption of the Indonesian volcano Samalas in 1257. In a climate model simulation of the past thousand years, these mega-eruptions are, unsurprisingly, followed by mega-cold spells that reduce global temperatures by 2°F (more than 1°Celsius). But tracers of past climate, such as tree rings and polar ice thousands of years old, tell a different story. These records don't indicate such a drastic, worldwide cooling following mega-eruptions.
The mismatch between eruptions' effects in past climate records and in climate models became widely recognized after a major international study of climate model performance, completed in 2012. “The whole community went back to the drawing board and said, ‘What's going on here?’” said Dr. Allegra LeGrande of NASA's Goddard Institute for Space Studies, New York, lead author of the new study. Research and testing indicated that the problem was likely to center on how processes are represented in the models in a simplified way when they can’t be explicitly represented in their full complexity.
Strong eruptions shoot a complex stew of gases into the atmosphere: sulfur compounds, water vapor, halogens, carbon compounds and others. Atmospheric chemists have learned a great deal about the chemical reactions these gases and aerosols trigger in the atmosphere — and the climate consequences. Until very recently, however, computational technology limited the scientists’ ability to put all of their understanding of volcanic emissions’ chemistry-climate interactions to work in computer simulations. Sulfur compounds, especially sulfur dioxide, are key to post-eruption cooling, so modelers had previously focused on sulfur chemistry. New technology now allows them to see how all the various gaseous emissions — including water in addition to sulfur dioxide — influence climate following a mega-eruption.
The stratosphere is naturally extremely dry. Without erupted water vapor, there wouldn't be enough water in this atmospheric layer for critical reactions with sulfur dioxide to occur. Models that don't track water vapor show sulfur dioxide lingering too long in the stratosphere. Additional water from the volcano speeds up the change of sulfur dioxide gas into sulfate aerosols and also helps the aerosol particles grow bigger more quickly. The size of the aerosols is important because larger particles cause more warming than cooling.
LeGrande and her coauthors simply added erupted water vapor to the NASA Goddard Institute for Space Studies' ModelE climate model. “We did a preliminary set of experiments that kept track of both sulfur and water,” as she explained it. “We showed that water can change the response to the sulfur dioxide injection.” For a Samalas-sized mega-eruption, tracking both sets of compounds reduced the subsequent global cooling by about a factor of three over simulations that did not track water.
LeGrande notes this study is only one step toward more realistic simulations of eruptions. “We've shown that water is important, but we need a full chemistry picture of what's in the volcanic plume,” she said. “We believe future work will show the importance of other constituents, like ash and halogens. Our goal is to make sure that we have the best toolkit we can have for studying climate, including future volcanic eruptions.”
The study was motivated by a paleoclimate problem, but LeGrande noted that it has implications for the future as well. “If a mega-eruption comes along next year, we’re better prepared than we were two years ago. The whole point of studying paleoclimate is that we want a model that can accurately simulate climate — period.”
NASA science flights study effect of summer melt on Greenland Ice Sheet
By Maria-José Viñas,
NASA's Earth Science News Team
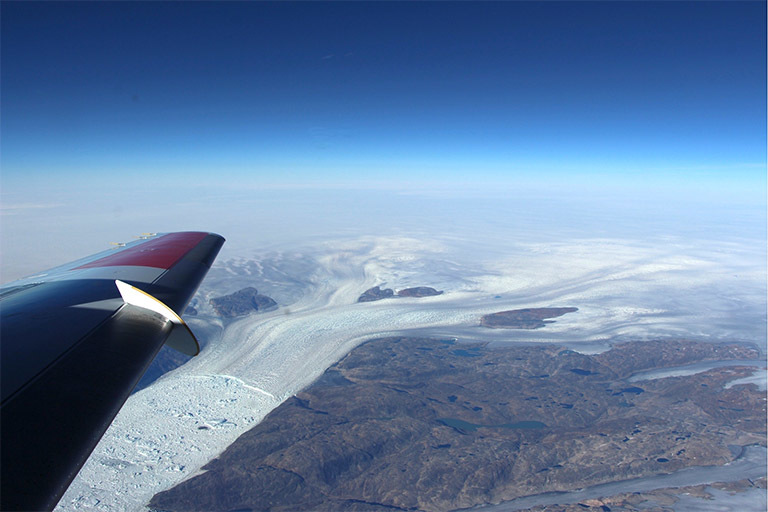
Helheim Glacier, with its characteristic wishbone-shaped channels, as seen from about 20,000 feet in the sky. Credit: NASA/Operation IceBridge.
Operation IceBridge, NASA’s airborne survey of polar ice, is flying in Greenland for the second time this year, to observe the impact of the summer melt season on the ice sheet. The IceBridge flights, which began on Aug. 27 and will continue until Sept. 16, are mostly repeats of lines that the team flew in early May, so that scientists can observe changes in ice elevation between the spring and late summer.
“Earlier in IceBridge’s history, we only surveyed the elevation of these glaciers once a year,” said Joe MacGregor, IceBridge’s deputy project scientist and a glaciologist with NASA’s Goddard Space Flight Center in Greenbelt, Maryland. “But these glaciers experience the climate year-round. Now we’re starting to complete the picture of what happens to them as the year goes on, especially after most of the summer melting has already occurred, so we can measure their cumulative response to that melt.”
The image above, taken during a high-priority flight that IceBridge carried on Aug. 29, shows Helheim Glacier, with its characteristic wishbone-shaped channels, as seen from about 20,000 feet in the sky. Helheim is one of Greenland’s largest and fastest-melting glaciers. During the first week of the summer land ice campaign, IceBridge has also flown over glaciers along Greenland’s northwest, southeast and southwest coasts, and also over lines that the Ice, Cloud, and land Elevation Satellite (ICESat) flew over Greenland during its 2003-2009 period of operations, to observe how ice elevation has evolved since then. Future flights will cover critical areas in central and southern Greenland, such as the world’s fastest glacier, Jakobshavn Isbræ.
For this short, end-of-summer campaign, the IceBridge scientists are flying aboard an HU-25A Guardian aircraft from NASA's Langley Research Center in Hampton, Virginia. The Guardian is a version of an early-generation Falcon 20 business jet, modified for service with the US Coast Guard and later acquired by NASA. It The plane carries a laser instrument that measures changes in the ice elevation, a high-resolution camera system to image the surface, and an instrument to infer the surface temperature. Due to the Guardian’s limited range, the flights will be shorter (3.5 hours long) than the 8-hour missions carried during IceBridge’s spring Arctic campaign, but the team expects to fly twice a day whenever possible.
The mission of Operation IceBridge is to collect data on changing polar land and sea ice and maintain continuity of measurements between ICESat missions. The original ICESat mission ended in 2009, and its successor, ICESat-2, is scheduled for launch in 2018.
For more about Operation IceBridge and to follow the current campaign, visit:
NASA begins study of Australia's Great Barrier Reef
From NASA
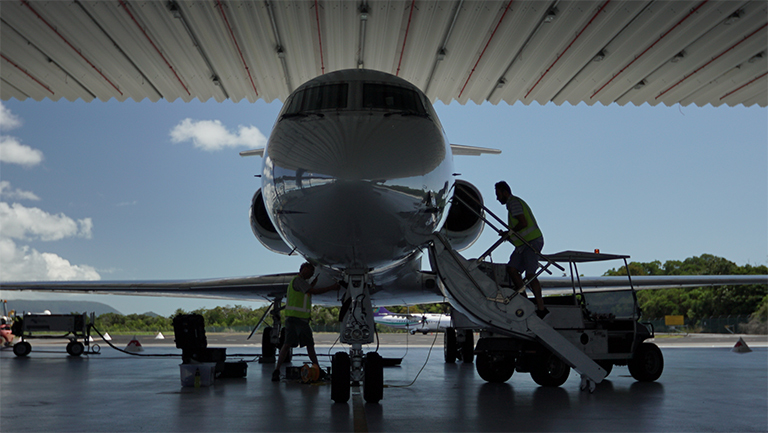
The Gulfstream III carrying NASA's PRISM instrument being readied for science flights from Cairns, Australia. Credit: NASA/JPL-Caltech/BIOS.
A NASA airborne mission designed to transform our understanding of Earth's valuable and ecologically sensitive coral reefs has set up shop in Australia for a two-month investigation of the Great Barrier Reef, the world's largest reef ecosystem.
At a media briefing today at Cairns Airport in North Queensland, Australia, scientists from NASA's COral Reef Airborne Laboratory (CORAL) mission and their Australian collaborators discussed the mission's objectives and the new insights they expect to glean into the present condition of the Great Barrier Reef and the function of reef systems worldwide.
"CORAL offers the clearest, most extensive picture to date of the condition of a large portion of the world's coral reefs," said CORAL Principal Investigator Eric Hochberg of the Bermuda Institute of Ocean Sciences (BIOS), Ferry Reach, St. George's, Bermuda, prior to the briefing. "This new understanding of reef condition and function will allow scientists to better predict the future of this global ecosystem and provide policymakers with better information for decisions regarding resource management."
Bleached and stressed coral on the Great Barrier Reef. Credit: NASA/JPL-Caltech/BIOS.
CORAL's three-year mission combines aerial surveys using state-of-the-art airborne imaging spectrometer technology developed by NASA's Jet Propulsion Laboratory, Pasadena, California, with in-water validation activities. The mission will provide critical data and new models for analyzing reef ecosystems from a new perspective. CORAL will generate a uniform data set for a large sample of reefs across the Pacific Ocean. Scientists can use these data to search for trends between coral reef condition and the natural and human-produced biological and environmental factors that affect reefs.
Over the next year, CORAL will survey portions of the Great Barrier Reef, along with reef systems in the main Hawaiian Islands, the Mariana Islands and Palau.
In Australia, CORAL will survey six discrete sections across the length of the Great Barrier Reef, from the Capricorn-Bunker Group in the south to Torres Strait in the north. Two locations on the reef — one north (Lizard Island Research Station) and one south (Heron Island Research Station) — will serve as bases for in-water validation activities. Scientists from Australia's Commonwealth Scientific and Industrial Research Organisation (CSIRO) and the University of Queensland in Brisbane are collaborating with NASA and BIOS to conduct additional complementary in-water validation activities.
The Great Barrier Reef: Australia's national treasure
Located in the Coral Sea off Queensland, the Great Barrier Reef encompasses more than 2,900 individual reefs and 900 islands. It is more than 1,400 miles (2,300 kilometers) long and covers an area of about 133,000 square miles (344,400 square kilometers). The largest single structure made by living organisms on Earth, the reef teems with biodiversity, including about 400 species of coral. It attracts about 2 million visitors a year; in turn, tourism and fishing generate billions annually and employ tens of thousands of people. However, the reef faces environmental pressures from various human and climate change impacts.
"The Great Barrier Reef is Australia's national treasure, so having a broader understanding of its condition and what's threatening it will help us better understand how we can protect it," said Tim Malthus, research leader of CSIRO's Coastal Monitoring, Modeling and Informatics Group in Canberra, Australia. "Along with surveying several large sections of the reef, CORAL will also survey the health of corals in the Torres Strait, a complex high-tide area that has been historically less studied. It is also opportunistic for us to see if the reef is recovering after the recent bleaching event."
Stuart Phinn, professor of geography at the University of Queensland (UQ), said CORAL will provide Australian coral reef science and management with unique new maps and mapping approaches. These will expand ongoing efforts to map and understand Great Barrier Reef dynamics. "Being able to support and collaborate on NASA's CORAL project will enable groups like ours to advance our capabilities and transfer them to Australian science and management agencies," Phinn said. "Part of this includes building a process for mapping the entire reef. UQ and CORAL will exchange field data, knowledge and experience to cross-validate mapping and monitoring approaches."
An urgent need for better data
Around the world, concerns among scientists, resource managers and the public that coral reef ecosystems are degrading at alarming rates due to human-induced factors and global change have motivated increased assessment and monitoring efforts. The urgency of the problem has forced estimates of global reef status to be synthesized from a variety of local surveys with disparate aims, methods and quality.
The problem with current assessments of reef degradation, said Hochberg, is that the data supporting these predictions are not uniform and surprisingly sparse. "Virtually all reef assessments to date rely on in-water survey techniques that are laborious, expensive and limited in spatial scope," he said. "Very little of Earth's reef area has been directly surveyed. More importantly, there are no existing models that quantitatively relate reef conditions to the full range of biological and environmental factors that affect them -- models that can help scientists better understand how coral reefs will respond to expected environmental changes. CORAL addresses an urgent need in the face of ongoing worldwide reef degradation, and also serves as a pathfinder for a future satellite mission to globally survey the world's reefs."
Natural, balanced coral reefs comprise mosaics of coral, algae and sand on the seafloor that, together, drive the structure and function of reef ecosystems. When corals die, algae rapidly take over their skeletons. A non-stressed, healthy reef will usually increase coral coverage as it recovers from disturbance. But when a stressed reef is disturbed, the carbonate structure of its coral erodes, and the reef ultimately becomes a flat-bottom community dominated by algae, shifting rubble and sand, with little to no coral recovery. Such ecosystem phase shifts, as they are called, represent a radical change in a reef's character, marked by a decline in the diversity of reef flora and fauna.
CORAL will generate scientific data products describing coral reef condition, measuring three key components of reef health for which we currently have limited data: composition, primary productivity and calcification. Primary productivity is a measure of how much energy is available to drive biological activity in a reef system. Calcification measures the net gain in carbonates, which determine a reef's long-term growth.
PRISM: Shining new light on coral reef condition
To accomplish its science objectives, CORAL will use JPL's Portable Remote Imaging Spectrometer (PRISM). PRISM will literally peer through the ocean's surface to generate high-resolution images of reflected light in the specific regions of the electromagnetic spectrum important to coral reef scientists. Mounted in the belly of a modified Tempus Solutions Gulfstream IV aircraft, PRISM will survey reefs from an altitude of 28,000 feet (8,500 meters) to generate calibrated scientific data products.
"PRISM builds on an extensive legacy of JPL spectrometers that have successfully operated for NASA and non-NASA missions," said Michelle Gierach, NASA CORAL project scientist at JPL. "It provides the coral reef science community with high-quality oceanographic imagery at the accuracy, range, resolution, signal-to-noise ratio, sensitivity and uniformity needed to answer key questions about coral reef condition. PRISM data will be analyzed against data for 10 key biological and environmental factors affecting coral reef ecosystems, acquired from pre-existing data sources."
NASA collects data from space, air, land and sea to increase our understanding of our home planet, improve lives and safeguard our future. NASA develops new ways to observe and study Earth's interconnected natural systems with long-term data records. The agency freely shares this unique knowledge and works with institutions around the world to gain new insights into how our planet is changing.
For more information about NASA's Earth science activities, visit: